Section Headings
- The Rich need Relief from their Tax Burden?
- Progressive Income Tax
- Regressive Social Security Tax
- Social Security: The Working Class Tax
- The Employer Contribution: the Hidden Tax
- Federal Taxes = Income Tax + Social Security Taxes
- The Enormous Amount of Federal Taxes paid by the Wealthy
- The Enormous Disposable Income of the Wealthy after Federal Taxes
- The Homeowner Interest Deduction provides a Great Tax Write-off
- Disposable Income after Taxes & Rent/Mortgage Payments
- Social Security Taxes: A Burden upon the Working Poor
- Obsessive Attachment to Tax Injustice diminishes Life’s Experience
The Rich need Relief from their Tax Burden?
The major media, including television and newspaper, regularly employ buzzwords that suggest that income taxes are excessive. 'Tax burden' and 'tax relief' are two phrases that are frequently employed in this regard. What is the underlying message of these seemingly innocuous phrases?
In a more modern context, the image might be one of international assistance coming to the aid of a community struck by a natural disaster, such as an earthquake or tsunami. Direct Relief International is the name of a global organization that employs the word 'relief' in this manner. As such, 'relieving’ someone of a ‘burden' is likely to evoke an image of someone lightening an unbearable load by removing some of it.
Politicians and the Media regularly employ these phrases in the ongoing debate over the wisdom of raising or lowering income tax rates. Most often these terms are used to justify tax cuts for America’s highest wage earners. These terms were first employed during the Reagan and Bush era to justify their proposed ‘tax relief’ from the ‘tax burden’ on the wealthy. The same phrases have continued to be part of the Media characterization of every political discussion regarding appropriate income taxes.
The intent of this article is to dispel these Media myths. These misconceptions are not factually based, but rather rely upon innuendo and half-truths. We will carefully analyze current data and provide easily comprehensible graphs in support of our claims. The following 3 paragraphs will preview our 3 central arguments.
Initially, we argue that the notion that the federal income tax claims a higher percentage of a wealthy citizen’s income is simply untrue. Although the personal federal income tax is supposedly progressive, the functional reality of the federal tax system undermines any reasonable claim to such progressivity. When Social Security Taxes and the Mortgage Deduction are taken into account, the tax percentage rate is fairly equivalent (about 30%) for all income levels, except the poorest wage earners.
Although the percentages are roughly equal, it is true that wealthier Americans pay a larger dollar amount in federal income taxes. However, when we examine personal disposable income across the income spectrum, a second issue emerges. It is evident that these larger dollar amounts are in no way burdensome. The wealthy have an enormous amount of disposable income left over after tax and mortgage payments. This is especially true when compared with the disposable income of middle and lower class wage earners. In other words, the quantitative ‘burden’ on the upper tax brackets does not indicate a need for tax relief.
And finally, we suggest that when we consider the notion of a ‘burden’ on American taxpayers, we should look to the opposite end of the tax bracket. By any functional measure, the wage earners on the lowest rungs experience the greatest tax burden. If anyone deserves relief, it is this segment of society.
Read on for details.
Progressive Income Tax
In general there are three types of taxes: Progressive, Regressive, and Flat.
- Flat taxes: everyone pays the same percentage of their income to the Government, whether rich or poor.
- Progressive Taxes: those who earn more money pay a higher percentage of their income in taxes than those who make less money.
- Regressive Taxes: those who earn less money pay a higher percentage of their income than those who make more money.
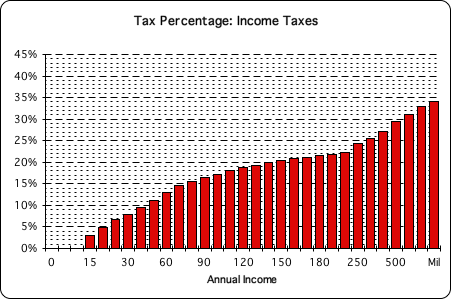
An examination of the design of the Federal Income Tax reveals its intentionally Progressive nature. The chart below displays the progressivity of the American personal income tax.
Percentage of Income to Federal Income Taxes (Without Write-offs)
Let us briefly examine how we came up with the numbers behind the graph.
Graduated income brackets in the American tax system generate the progressive curve that is reflected in the chart. There are 7 tax brackets, which begin at 10% and rise gradually towards the top bracket, which is 40%. The income earned in each tax bracket is taxed at a different percentage. For instance, income below $9K is taxed at 10%. In the next bracket, income between $9K and $36K is taxed at 15%; income between $36K and $88K at 25%; between $88K and $183K at 28%; and so forth. Income in the top tax bracket of $400K and above is taxed at 40%.
A common misconception is that those in the highest tax bracket pay 40% of their annual earnings in Federal Income Taxes. That is simply not the case. Due to the graduated nature of the Federal Income Tax, the first $9K of income is taxed at 10% no matter how much money an individual earns in a year. The next $27K of annual income is taxed at 15%. The next $48K is taxed at 25%, and so on through each income bracket. Only income earned above $400K is taxed at the 40% rate. Due to the graduated nature of the taxes, the million-dollar-a-year earner actually pays about 34%, not 40%, on his annual income.
We made one adjustment in our chart to reflect functional tax reality. All individual taxpayers are entitled to the automatic standard deduction combined with the personal exemption. In other words, everyone has $10K automatically taken off their income, no matter how much they earn in a year. This is why individuals who earn less than $10K/year pay no Income Tax. The figures that generate the chart reflect this $10K adjustment.
While Federal Income Taxes are arguably progressive, they are just one type of Federal Tax. The picture is incomplete until we also consider the effect of the Social Security Tax on wage earners. When the Social Security tax is included, the claims of progressivity within the American federal tax system take on an entirely different light.
Regressive Social Security Tax
Not only do most Americans pay Income Taxes to the Federal Government, many also pay Social Security Taxes. While Income Taxes are progressive, Social Security Taxes are regressive. In other words, those who earn the least amount of money pay the biggest percentage of their income in this type of tax and vice versa. The following graph illustrates the extreme regressivity of the Social Security Tax.
Percentage of Income to Social Security Taxes
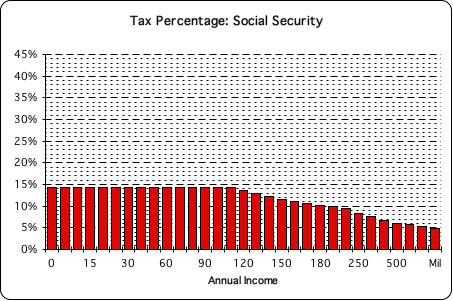
No matter how small the paycheck, there are no allowable deductions. A full 15.3% of the first $117K of income is funneled to the government for Social Security Taxes. Conversely, the individual earning a million dollars a year in salary only pays SS taxes on the first $117K. Consequently, this taxpayer contributes less than 5% of his income towards Social Security Taxes.
Notice how the line associated with the red bar starts high and then fades in significance. It is visually apparent that the wealthiest segment of society pays the least percentage of their income towards Social Security Taxes, while those collecting the smallest paychecks pay the highest percentage.
In summary, the Social Security Tax is clearly regressive. It is applied on a sliding scale that benefits only the wealthy. Those earning the least amount of money pay the greatest percentage of their income in Social Security Taxes, while those earning the most pay the least. Income Up: Social Security Tax Rate Down; and vice versa.
Social Security: The Working Class Tax
This discrepancy between the Taxes paid by the Rich and Poor is aggravated when one considers that only the Working Class is subject to Social Security Taxes. In this context, the Working Class includes those who run their own business and both salaried and hourly wage earners.
Many forms of income are not subject to Social Security Taxes. These include:
• Stock earnings
• Dividends
• Interest earnings
• Property Sales
• Rent
• Corporate Profits
In other words, when one's assets (including money, stocks, or property) do the work, no Social Security Taxes are paid. Of course, the wealthier segments of our country are the ones most likely to be earning money in this fashion. It is primarily these individuals who have sufficient assets to generate income. Reiterating for retention: Asset Income is exempt from the Social Security Tax.
Let us summarize and refine our findings thus far. In terms of the Federal Taxes we have discussed, there are 2 general types of income – Worker Income and Asset Income. We have also discussed two types of federal taxes – Personal Income Tax and Social Security Taxes.
Income Tax is applied to both of these forms of Income. Income Taxes are Progressive. Income Up: Income Tax Percentage Up, and vice versa.
The Social Security Tax is only applied to Worker Income. Social Security Taxes are Regressive. Income Up: Social Security Percentage Down; and vice versa. Asset Income, while subject to Income Taxes, is exempt from this Working Class Tax.
The Employer Contribution, the Hidden Tax
The employer’s matching share of these taxes is mischaracterized as a contribution. In fact, the employer’s ‘contribution’ most often is a hidden tax on the worker. It does not typically come from the Employer's savings account or college fund, but rather this tax is paid from his anticipated labor costs. If the business owner doesn’t choose to accept a reduction in profits or to pass these costs on to the consumer, then labor will bear the brunt of the owner’s ‘contribution’.
One significant example of this hidden tax on labor is the effect on an employer’s willingness to provide raises to his workers. Employers typically perceive their matching contribution to Social Security taxes as a labor cost. This labor cost significantly cuts into the funds available to raise wages. No matter how generous the Employer is, s(he) must take this hidden tax into account when doling out bonuses or raises.
Due to matching tax contributions, the Employer pays far more for his employees than their salary or hourly rate indicates. Roughly speaking, it costs the Employer $8.61/hour for the minimum wage, $8/hour, worker. As far as the Employer is concerned, this elevated amount is the actual cost of the employee – not the amount stated on the employee’s paycheck. As such, the Employer Contribution can be viewed as a hidden tax that is ultimately born by the Employee's income.
The Social Security tax provides a double whammy. First, it is a direct payroll tax that can't be avoided. Second, the hidden tax contributes to the employer's labor costs, which impacts the ability to give raises. In other words, the minimum wage worker only takes home $7.39/hour of the $8.61/hour it costs the employer to pay him or her.
For this reason, we have utilized 15.3% rather than 7.65% when speaking about the Social Security Tax rate. This is the value that every employer must take into account when paying his employees.
Personal Income Tax + Social Security Taxes = Federal Tax
American Citizens typically pay two types of taxes on their wages to the Federal Government – the Personal Income Tax and Social Security Taxes. Let us combine these two types of taxes to see what they reveal. The red bars in the following graph represent the percentage of Income going to the Federal Government when the Social Security Tax is added to the Income Tax.
Percentage of Income to Taxes: Social Security + Income Tax
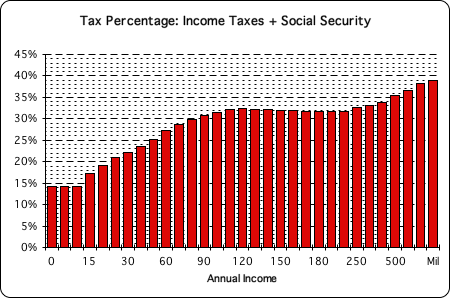
Adding the regressive Social Security Tax to the progressive Income Tax, clarifies the actual tax burden on wage earners. Two significant points emerge: 1) Even the poorest wage earners pay almost 15% of their income in federal taxes; 2) The tax burden of the wealthy becomes far less progressive when we consider the combined effect of the 2 taxes. While the tax burden represented by the combination of these taxes is still moderately progressive, the rising curve is much flatter (hence less progressive) than when the Income Tax graph is considered alone.
The Enormous Amount of Federal Taxes paid by the Wealthy
Those earning the most do pay the largest amount of actual dollars in taxes. The following graph indicates how much that is.
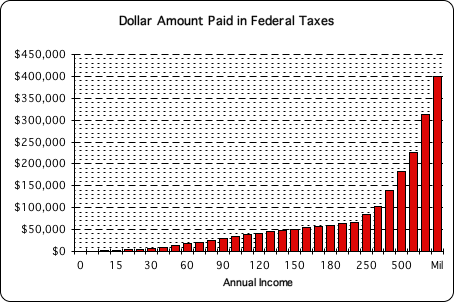
Ouch! We can feel their pain. Percentages are abstract. Real dollar amounts are just that – Real. It is easier for most of us to grasp the actual numerical amount that we must pay in taxes.
On the top end of the income scale, those making $100K per year pay $34K in taxes, $500K pay $152K a year, while those earning a million dollars pay $400K in taxes. On the bottom end of the scale, those making $50K/year pay $15K in taxes, while those making $10K/year only pay $1500 in taxes. In other words, those earning $500K/year pay a 100 times more in taxes than those earning $10K/year.
When we look at actual amounts of taxes paid rather than percentages, the amounts paid by the wealthy do appear to be staggering. It is understandable that those who call for tax relief for the wealthy would focus upon the enormous dollar amount paid in taxes. Yet these numbers are only part of the picture.
The Enormous Disposable Income of the Wealthy after Federal Taxes
Comparing tax percentages is one method of determining relative fairness. Another mode of comparison has to do with Disposable Income, i.e. how much money is left to spend after taxes are paid. This money is real. You can take it to the grocery store for food; make a rent or mortgage payment with it; or even buy a yacht or take a world cruise. A comparison of Disposable Incomes may shed more light upon economic reality for the taxpayer than do abstract Tax Percentages.
The following graph shows the disposable income that each income bracket has after taxes.
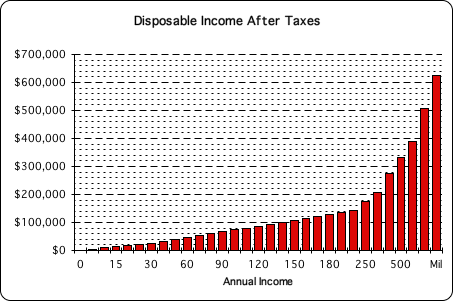
The real discrepancy between rich and poor strikes home. While the rich pay a higher tax percentage, they still have an enormous amount of money left over after taxes. For instance, the Disposable Income of those earning $30K per year is $20K; for the $150K earner it is over $100K; for those earning $500K, it is over $300K; for those making million dollars a year, it is over $600K to do with as they please; and so on up the income ladder.
Despite higher tax percentages, the real take home pay of the high wage earners dwarfs that of the average wage earner with his 5-digit income.
The Homeowner Interest Deduction provides a Great Tax Write-off
A vast majority of Americans make either rent or mortgage payments in order to secure living quarters. There is virtually no difference between a mortgage or rental payment in terms of the monthly budget. Both chunks of money are due at a regular time each and every month.
For the sake of illustration only, let us examine a typical American scenario to compare the difference in the percentage of taxes paid by a Homeowner versus a Renter. For purposes of comparison, let us assume that individuals pay 25% of their income to rent or mortgage. Of course typically, those making less pay a much greater percentage, while those making more pay a smaller percentage. Under this formula someone making $30K per year would pay $7500 per year towards housing ($625 per month). On the other hand, someone making $80K would pay $20,000 per year in rent ($1,667 per month).
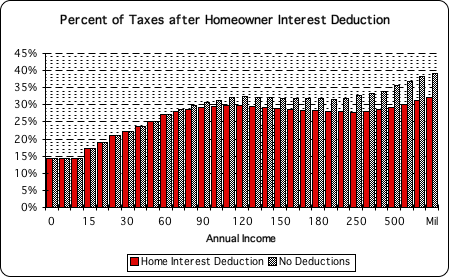
The following graph compares the tax percentage paid by wage earners, both hourly and salaried, before and after the Homeowner’s Interest Deduction. The red bar represents the percentage of federal taxes paid by those who are able to take advantage of the Home Mortgage Interest Deduction. This percentage includes Social Security Taxes and the Federal Income Tax after the Mortgage Interest Deduction. The taller grey bars represents the percentage of Federal Taxes paid on wages, but without the Mortgage Interest Deduction (as was illustrated in the graph entitled ‘Percentage of Income to Taxes: Social Security + Income Tax’). The difference in the size of the grey and red bars is based solely upon this one itemized deduction.
(Note: The Social Security Tax comes directly from every paycheck. There are no exemptions, write-offs or refunds, as there may be on an individual’s personal tax return. In other words, this Working Class tax is unaffected by the many Itemized Deductions that are employed to reduce the tax liability of wealthier Americans.)
Adjusted Tax Percentage for those with a Homeowner’s Interest Deduction
We made 3 assumptions in producing the above graph:
1. The homeowner spends 25% of his income in home mortgage payments.
What can we learn from this graph?
This readily available homeowner’s mortgage interest deduction further minimizes the progressive nature of our federal income tax system. When only the Federal Income Tax is considered, the tax percentage difference between the $60K and the million dollar wage earners is 21% – arguably quite progressive. When the regressive Social Security Taxes are included, the tax percentage difference between these two tax brackets drops dramatically to 12%. Clearly the inclusion of Social Security Taxes greatly dampens the progressive nature of the Federal Tax System.
Further, when the mortgage interest deduction is taken into account, the tax percentage difference drops to 5%. This itemized deduction further diminishes the progressivity of the tax system – approaching the status of a flat tax. In other words, those with a million dollar salary pay just a slightly higher percentage of their income in taxes than those earning $60K per year. Check out the following table for some specific comparisons of selected tax brackets.
Federal Tax Percentages |
|||||
Interest |
Federal Tax- |
||||
Wages |
Income Tax |
Social Security |
Total Tax |
Deduction |
Deduction |
60K |
13.1% |
14.2% |
27.3% |
0.0% |
27.3% |
100K |
17.2% |
14.2% |
31.4% |
1.9% |
29.5% |
500K |
29.4% |
5.1% |
35.5% |
6.4% |
29.1% |
1000K |
34.1% |
4.9% |
39.0% |
6.9% |
32.1% |
Difference |
21.0% |
11.7% |
4.8% |
||
It is evident from even a cursory examination of the above table that the standard Mortgage Interest Deduction (only available to Homeowners) further flattens the progressivity of the Tax Percentage Curve. Once the interest deduction and Social Security Taxes are taken into account, those wage earners making $60K and above pay a fairly equivalent percentage of their income in federal taxes. For instance, there is a negligible difference - a mere 4.8% – in the Tax Percentage between those earning $60K and those earning a million dollars per year. Ironically, for those earning huge salaries, a simple way to reduce income taxes might be to purchase an even more expensive home.
Note: this discussion only addresses the tax advantages of the mortgage interest deduction. The mortgage interest deduction is only one of many tax write-offs available to wealthier citizens, which are unavailable to those near the lower end of the pay scale. Each of these tax write-offs further reduces the tax percentage that the prosperous pay and consequently reduce the progressivity of the federal tax system. It would be fair to say that some of our wealthiest citizens claim tax benefits that completely eliminate the progressivity of the tax system.
Because of the large amount of the annual interest payment, most Homeowners achieve the level of the $6100 base deduction. Once this threshold has been reached all the other potential tax deductible expenses are available. Examples include medical expenses, state tax payments and business expenses.
In other words, the mortgage interest deduction makes possible other tax write-offs that are frequently unavailable to the Renter. One accountant says that mortgage interest is the ‘doorway’ to itemized deductions. Without mortgage interest, most taxpayers are unable to itemize any deductions that reduce taxable income.
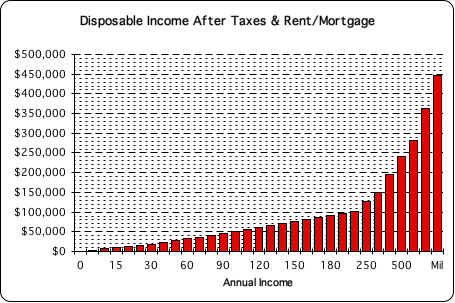
Disposable Income after Taxes & Rent/Mortgage Payments
Thus far our discussion has focused upon the relative tax percentages on a range of income tax brackets. We’ve also examined these same tax brackets for disposable income after taxes. Let us now add an additional level of clarification by considering disposable income after taxes and rent or mortgage payments have been subtracted.
Social Security Taxes: A Burden upon the Working Poor
Let's start with a minimum wage employee, someone making $8 per hour. Suppose this individual works a normal 40-hour week for 52 weeks per year. This translates into roughly $17K per year - gross income. Employing the same computations yields about $21K annual income at $10 per hour and approximately $25K annual income at $12 per hour.
This is not their take-home pay. This is how much these individuals earn before taxes. The Social Security Tax is taken out of their paycheck no matter how little they earn, and these individuals must still also pay some of their hard-earned money in income taxes.
We then subtract these Federal Taxes from the Annual Income to arrive at the Take-Home Pay, both annual and monthly. For comparison, the table also shows the Federal Taxes and Take Home Pay of individuals making $100K and $500K per annum. While the differences in Federal taxes paid are large, the disparities in Take-Home Pay are even more striking. These figures are shown in the table below.
| Federal Taxes | Take-Home Pay | ||||
|---|---|---|---|---|---|
| Hourly Wage | Annual Income | Social Security | Income Tax | Annual | Monthly |
| Minimum $8/hr | $16,640 |
$1273 |
$664 |
$14,703 |
$1225 |
| $10/hr | $20,800 |
$1591 |
$1170 |
$18,039 |
$1503 |
| $12/hr | $24,960 |
$1909 |
$1794 |
$21,257 |
$1771 |
$100K |
$7650 |
$18,494 |
$73,856 |
$6155 |
|
$500K |
$15,649 |
$151,804 |
$332,547 |
$27,712 |
|
The following table shows what happens when Rent is added into the computations. We assumed that the individual would pay 25% of their Take Home Pay in Rent. Of course, paying $300/month and even $400/month in Rent is unrealistic in many, if not most areas of the country. The individual must utilize this disposable income to purchase food and clothing, as well as take care of medical expenses and transportation. In other words, the Working Poor, if they are lucky, have just money enough left over to pay for necessities.
In addition the higher paid individuals probably have their medical costs taken care of by health insurance that is provided by their company. In other words, these individuals can pay for the necessities, food, clothing, and transportation, and still have plenty of disposable income left over for luxuries, including vacations and such.
| Monthly Take-Home | 25% Rent | Disposable Monthly Income after Rent | |
|---|---|---|---|
| Minimum $8/hr | $1225 |
$306 |
$919 |
| $10/hr | $1503 |
$376 |
$1127 |
| $12/hr | $1771 |
$443 |
$1328 |
| $100K/year | $6155 |
$1539 |
$4616 |
| $500K/year | $27,712 |
$6928 |
$20,784 |
In summary, even though the minimum wage employee pays a smaller percentage of his income in taxes, this tax bite impacts his ability to pay for necessities. In contrast, even though the higher paid individuals in our society pay a much higher percentage of their income in taxes, their disposable income after their mortgage payment is certainly large enough to afford the luxuries of life. Instead of the Rich needing 'relief' from the tax 'burden', it is the Working Poor that need the 'relief'.
Obsessive Attachment to Tax Injustice diminishes Life’s Experience
I work in the fine dining restaurant business and have experienced unhappy millionaires, unable to even enjoy the gourmet food and the company of their family. I have also known happy dishwashers, always smiling and laughing despite the drudgery of their work. Personally, I am extremely content with my life, despite making only $40K per annum. I am surrounded by love and have the opportunity to surmount life’s daily challenges. Of course, these are merely anecdotal illustrations that support the results of the experimental studies.
Making sense of the experimental results is straightforward. Although money can make the body happy, humans are emotional beings. As such, both the health of our attitudes and our relationships with others are far more important than how much money we have. A loving relationship with partner, friends, children and work mates has a deeper influence upon our state of mind than our ability to spend money. Perhaps our greatest happiness flows from loving relationships, which, while difficult, are possible for both rich and poor alike.
It is possible for any of us to taint our emotional state with thoughts of envy and greed. Dwelling in these negative emotions diminishes our capacity to enjoy what we do have – our simple joys and pleasures. To fully appreciate Life’s bounty, it is necessary for all of us, whether rich, poor or in-between to release obsessive attachments to the things of this world, whether they be material or immaterial. Otherwise, we won’t be able to fully experience the delicious taste of food, the beauty of a sunset, and more importantly the love from partner, family and friends.
Our concerns about the perceived injustices of our tax structure can become this sort of obsession. Whatever tax bracket we may be located in, we are not immune from concerns about the justice of the American tax system. If we are wealthy, we may resent the fact that we pay thousands, or even hundreds of thousands of dollars, more than our fellow citizens. If we are less well off, we may resent the enormous discrepancy between our take-home pay and that of the wealthier segments of society.
The figures make it manifestly clear that the large wage earners pay an enormous amount of money in taxes. The actual amount of out-of-pocket federal taxes does seem large. We understand the concern. We experience similar pain when we pay the 15% Self-employment tax on my wife's jewelry business every year. Although only several thousand dollars, it is painful to let go of this money. This is a natural human emotional reaction. We suffer when we must let go of something that is valuable to us. This is neither greedy, nor immoral, nor a sign of a substandard individual. It is very, very human.
Entire religions have been devoted to the goal of assuaging human suffering. Several schools of thought attempt to assist us to release our excessive attachment to our desires for things – both material and immaterial. Some strongly suggest that obsessively holding onto our attachments is one of the roots of suffering. In this sense, clinging to our money generates emotional suffering, whether rich or poor.
Instead of desperately moaning about our tax contribution to the greater society, we must attempt to release this money willingly, if not gladly. This 'letting go' process purifies our emotional state and allows us to experience Life more fully. The inability to let go may even become an obsession that can generate very negative attitudes. Releasing this attachment to our money, although healthy, is not particularly easy.
Just as the wealthy can torture themselves by dwelling upon how much they pay in taxes, the less well off can suffer similar psycho-emotional effects. The less wealthy may be tempted to resent the dramatic disparity between rich and poor in disposable after-tax income. They may also be angered by the plethora of income tax write-offs that are primarily available to those with higher incomes. Fuelled, these types of resentments can turn into bitterness, which will certainly taint Life's soup.
We should never allow an obsession with the perceived injustices of our tax system to undermine our ability to appreciate the important things in Life. Let us attempt to solve the surmountable challenges of our own existence and count the love that surrounds us as a blessing. Reiterating, moaning about how much we don't have or about how much we must surrender in taxes only pollutes our experience. Let go of the bitterness of comparison in order to enjoy life more fully.
The intent of this line of thinking is not to suggest that we should happily ignore perceived injustices in our tax system. We should hope for and, when we can, act for a more just assessment of taxes. In this light, check out the article Why America can afford Social Security for a more in depth discussion of possible improvements in America’s approach to taxation.
Tax Justice: More Articles
1. A Brief History of Deregulation & the Beginning of Free Market Capitalism: How free market capitalism results in the first Ponzi scheme; the near bankruptcy of France; peasant starvation; and then the French Revolution. Why regulation is mandatory.
2. A Brief History of Progressive Taxation: How progressive taxation combined with a social safety net tempers the boom-bust cycle that is innate to free market capitalism.
3. Why the US Tax System is not Progressive: The Tax Burden Myth: How Social Security is a Working Class Tax. How Unearned Income, the province of the wealthy, is not included in SS's tax base.
4. Obama's Medicare Surtax: first time Unearned Income taxed for Social Safety Net: How Obamacare includes Unearned Income for the first time ever in the tax base of Medicare – still not SS. How a Reverse Income Cap ($200,000) shelters the small investor from this tax. Why the Wealthy are afraid to confront this revolutionary precedent: the same process could be easily applied to SS taxes.
5.A Brief History of the Social Security System & Why it is Affordable: How the Social Security System benefits many classes of deserving American citizens besides the working class. How the SSS could be afforable for many decades to come by merely including Unearned Income, the province of the wealthy, in its tax base.
6. A Brief History: Empire vs. Tribe How the Tribal model of government is egalitarian. How its primary focus is to both protect and encourage the growth of all citizens. How the Empire building model is hierarchical with the wealthy on top and the rest treated as disposable property. How its focus upon the military conquest of weaker cultures. How this dichotomy manifests in our classist tax system. How the wealthy avoid contributing their fair share to the good of the citizenry.